1D fields
For 1 space dimension fields \(f(x,t)\) there are 2 ways to render:
Movie 1D
Each frame shows the field at a specific time \(f(x,t_i)\).
 1from idefix2python import RunContext, Pipeline, Fig, LineMovie1D
 2from pathlib import Path
 3
 4projectPath = Path(__file__).parent / "data_examples"
 5task = "1D_test"
 6# By default the vtks are expected to be in {projetPath}/{task}/outputs/vtks/
 7
 8quantities = [
 9    LineMovie1D(
10        "Dust0_RHO",
11        r"$\rho^\mathrm{dust}$",
12        plot_coords=[0, 0],
13        title="Dust0 Density",
14        vmin=0,
15        vmax=1.5e-4,
16    )
17]
18fig0 = Fig(quantities, suptitle="Evolution of the density profile")
19
20runContext = RunContext(task, projectPath)
21
22if __name__ == "__main__":
23    pipeline = Pipeline(runContext, [fig0])
24    pipeline.run()
Space-Time Heatmap
A single figure showing the entire evolution of the field \(f(x,t)\).
 1from idefix2python import (
 2    RunContext,
 3    Pipeline,
 4    Fig,
 5    SpaceTimeHeatmap,
 6    OneComponentOneVariable,
 7)
 8from pathlib import Path
 9import numpy as np
10
11projectPath = Path(__file__).parent / "data_examples"
12task = "1D_test"
13# By default the vtks are expected to be in {projetPath}/{task}/outputs/vtks/
14
15
16def maxrho(v):
17    return v.x[np.argmax(v.data["Dust0_RHO"])]
18
19
20quantities = [
21    SpaceTimeHeatmap(
22        "Dust0_RHO",
23        r"$\rho^\mathrm{dust}$",
24        plot_coords=[0, 0],
25        title="Dust0 Density",
26    ),
27    OneComponentOneVariable(
28        "max_rhodust", "max_rhodust", plot_coords=[0, 0], compute=maxrho
29    ),
30]
31
32fig0 = Fig(quantities, suptitle="Dust density on a heatmap")
33
34runContext = RunContext(task, projectPath)
35
36if __name__ == "__main__":
37    pipeline = Pipeline(runContext, [fig0])
38    pipeline.run()
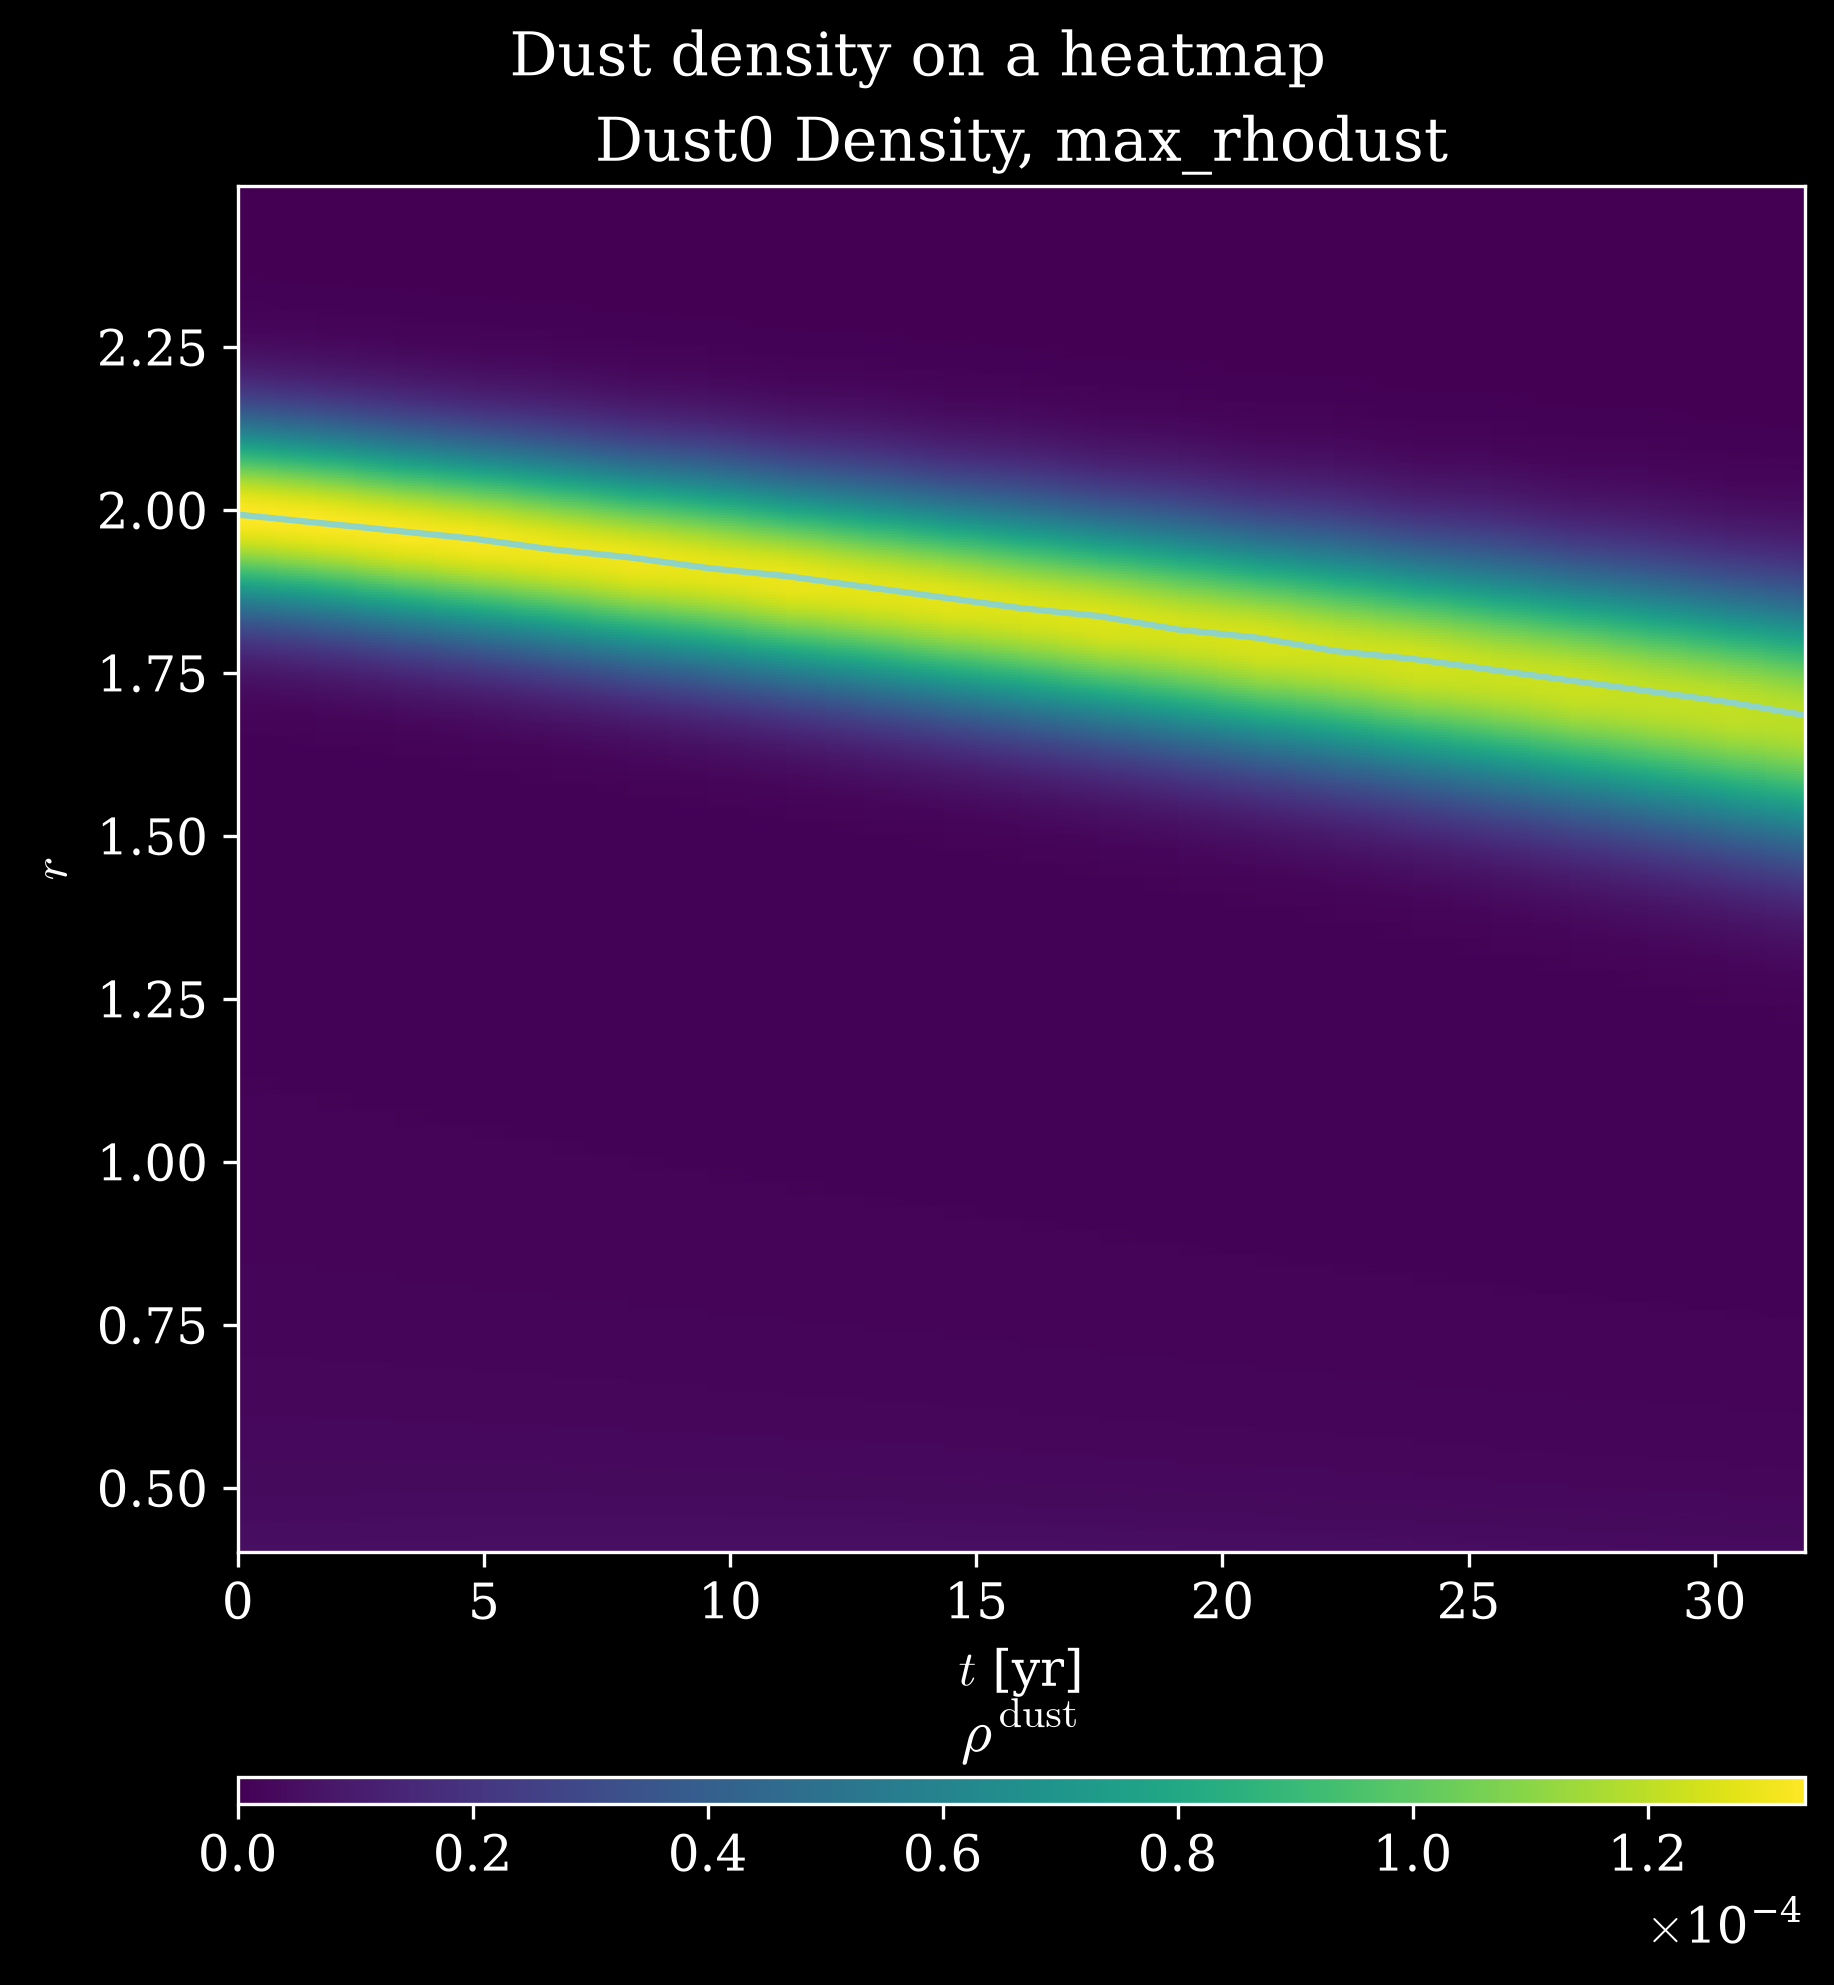
1D_test_fig0.png
Adding a reference line
On the heatmap, one can add a reference line (e.g., an analytical trajectory) by passing a ref_function to the SpaceTimeHeatmap object.
 1from idefix2python import RunContext, Pipeline, Fig, SpaceTimeHeatmap
 2import utilities
 3from pathlib import Path
 4
 5projectPath = Path(__file__).parent / "data_examples"
 6task = "1D_test"
 7# By default the vtks are expected to be in {projetPath}/{task}/outputs/vtks/
 8
 9
10def analytical_trajectory(t):
11    Stokes0 = 1
12    fluid = utilities.Fluid(0.05, -0.5, 0.125, -0.5, Stokes0=Stokes0)
13    r0 = 2
14    return utilities.integrate(fluid.vrDrift, r0, t)
15
16
17quantities = [
18    SpaceTimeHeatmap(
19        "Dust0_RHO",
20        r"$\rho^\mathrm{dust}$",
21        plot_coords=[0, 0],
22        title="Dust0 Density",
23        ref_function=analytical_trajectory,
24    )
25]
26fig0 = Fig(
27    quantities, suptitle="Dust density on heatmap, with an analytical trajectory"
28)
29
30runContext = RunContext(
31    task,
32    projectPath,
33    frameFolder="1D_test_withref",
34)
35
36if __name__ == "__main__":
37    pipeline = Pipeline(runContext, [fig0])
38    pipeline.run()
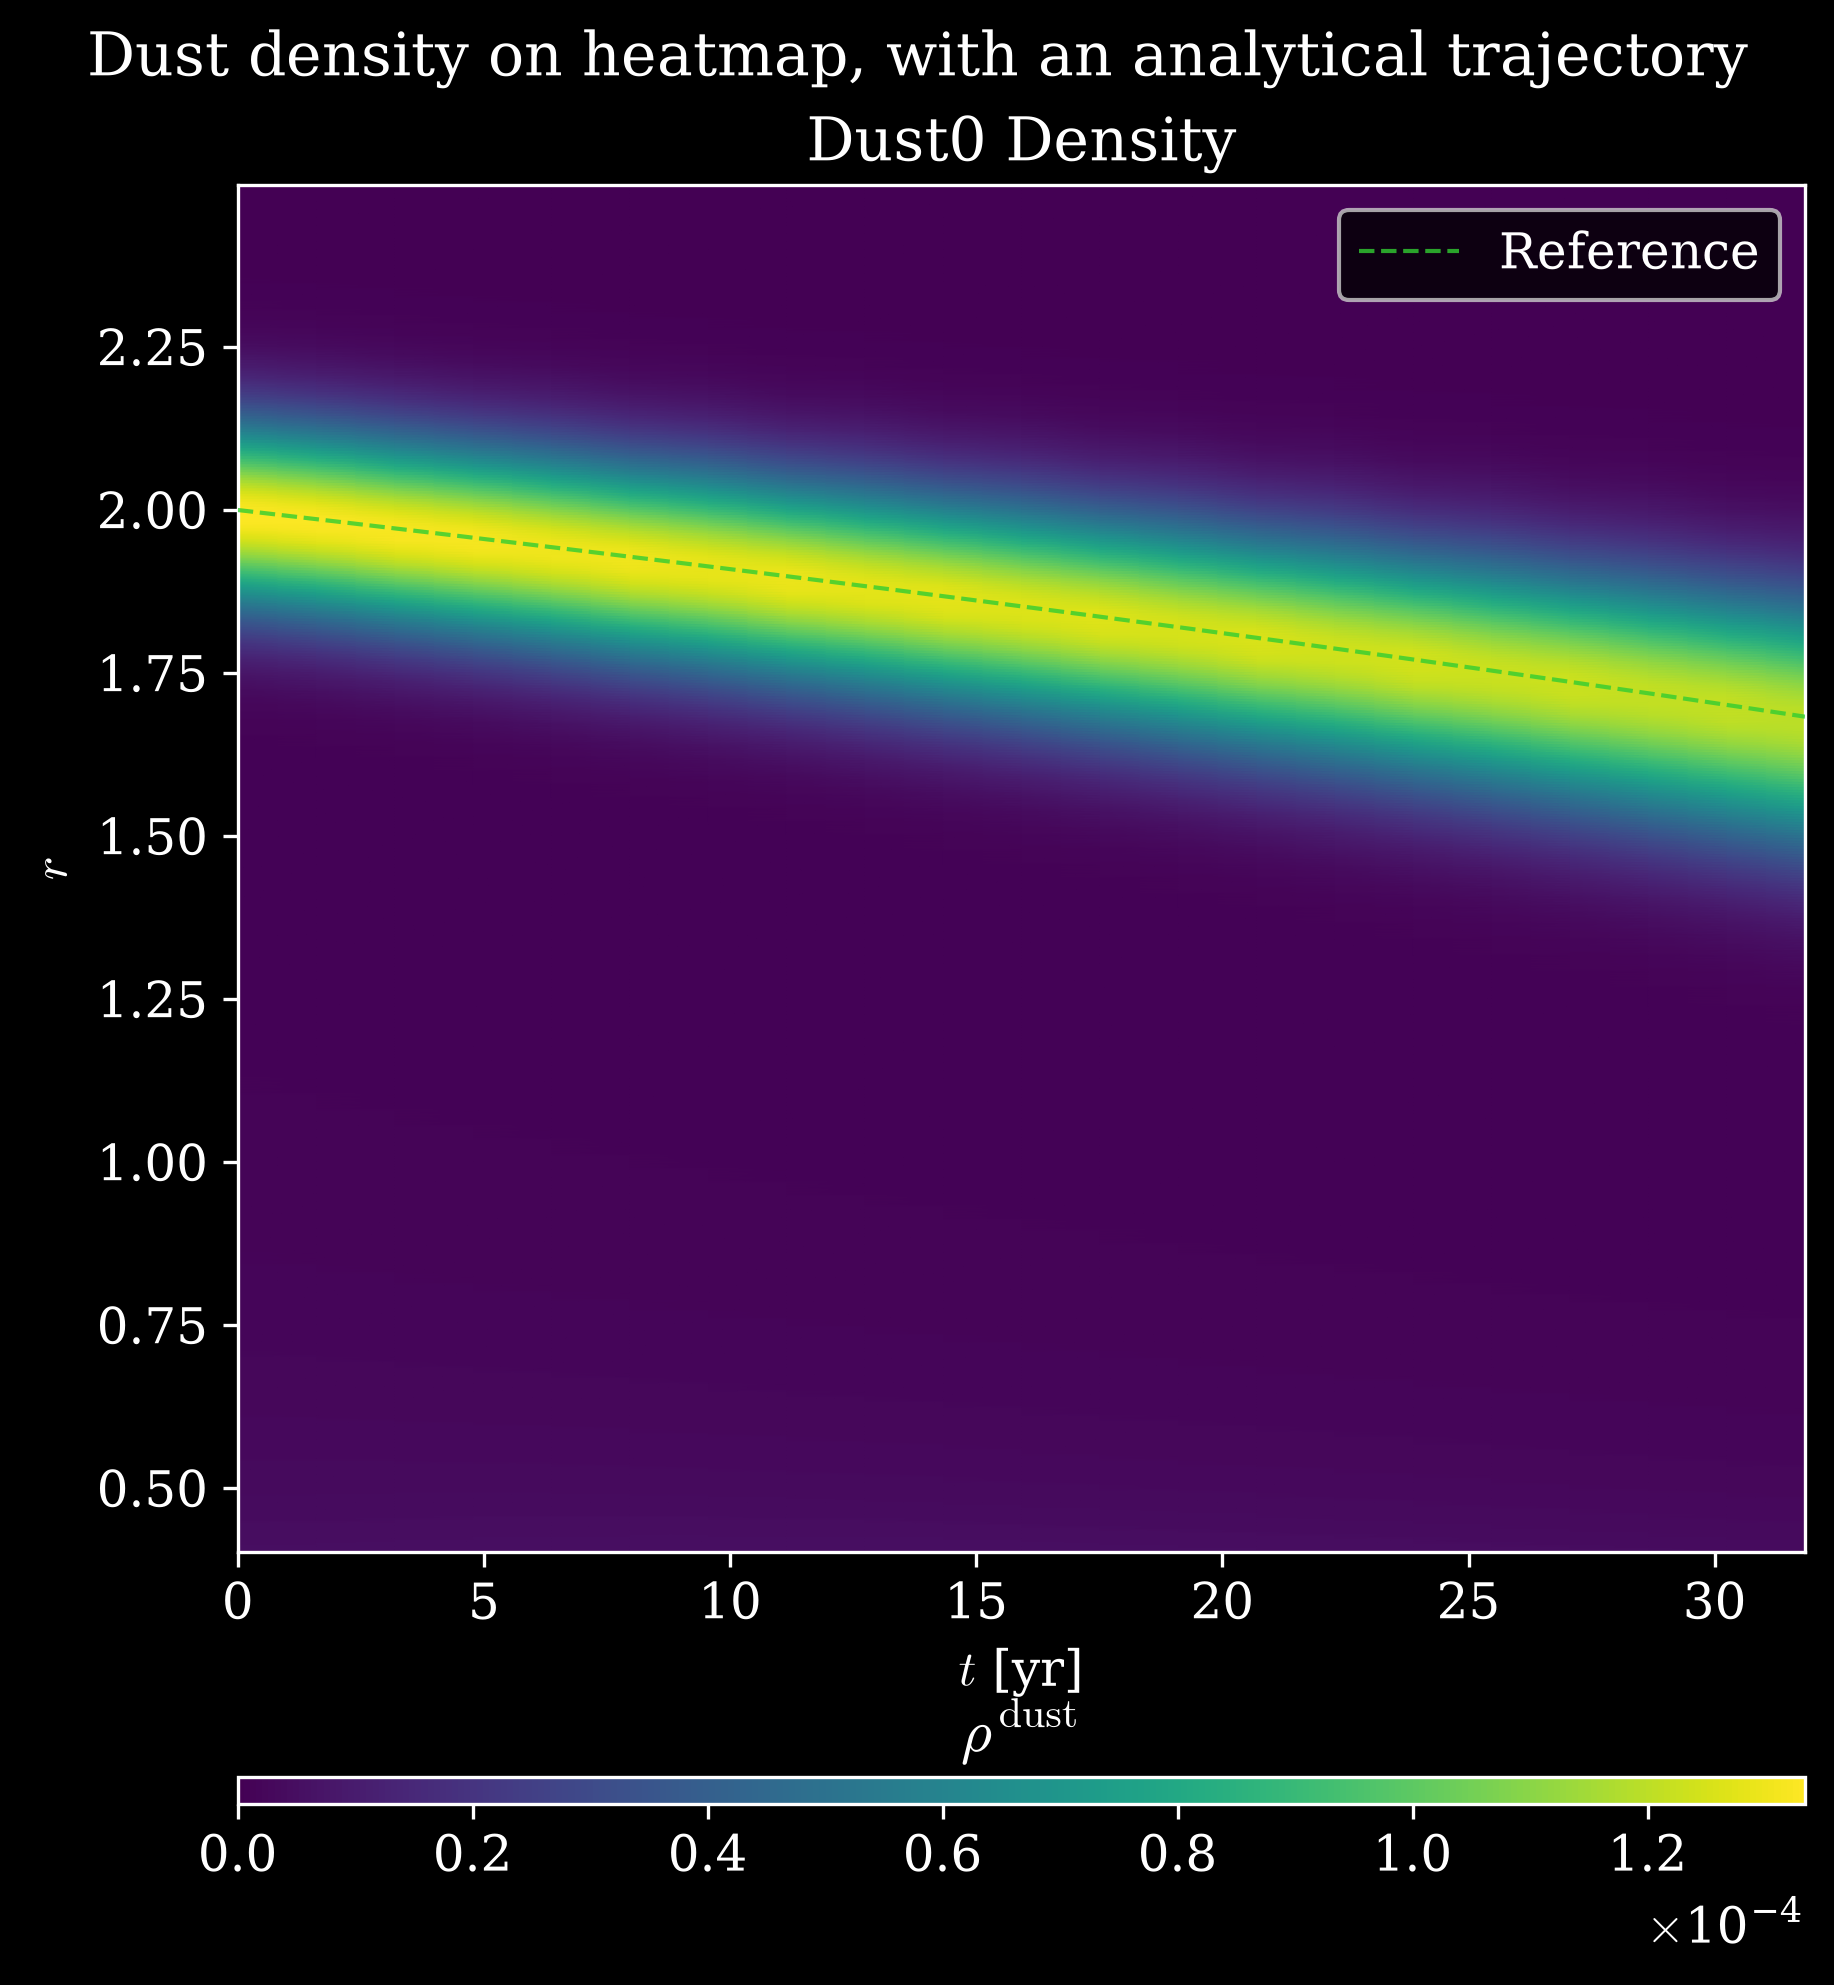
1D_test_fig0.png